DACA Denials
In July (2013) the USCIS Office of Performance and Quality reported 7.1% of DACA applications denied during review. That’s 1 in 13 who apply. Unlucky 13. Why the increase in DACA denials, when – until May and the first 360,000 reviews – the denial rate was less than 3%?
The official report linked above is a table of raw data. To understand what is going on, we need to see the picture that these numbers tell.
First, the denials:
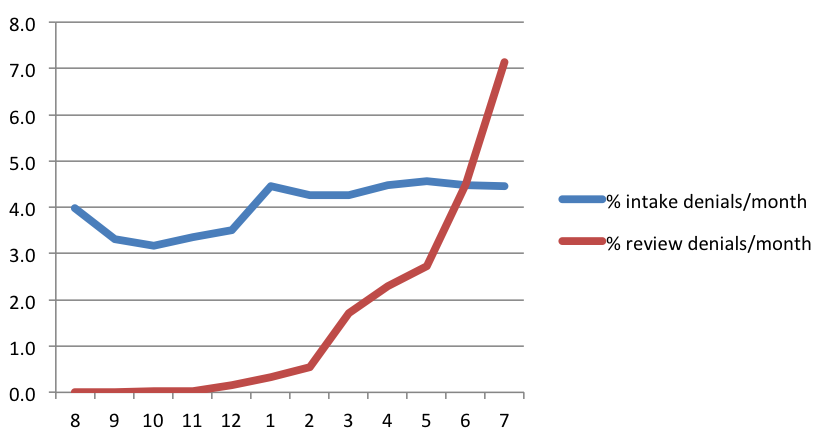
Rejections during intake have stayed at around 5%. Forms containing errors and omissions. Fees not included, etc.
But denials during review are growing. And since May, there is a clear trend – upwards.
What is going on? Have CIS introduced stricter processes after being ridiculed by Jeff Sessions in the Senate immigration debate? Is the “mass workshop” approach to DACA application preparation leading to poorer quality applications? Are there too many applications for the lawyers who perform “final review” in these workshops? Did people with marginal applications wait before applying for DACA?
The performance report doesn’t just give denial numbers – it shows how the service has been responding to a massive processing task.
The next graph shows the (average) number of applications that CIS have received each day over the last year.
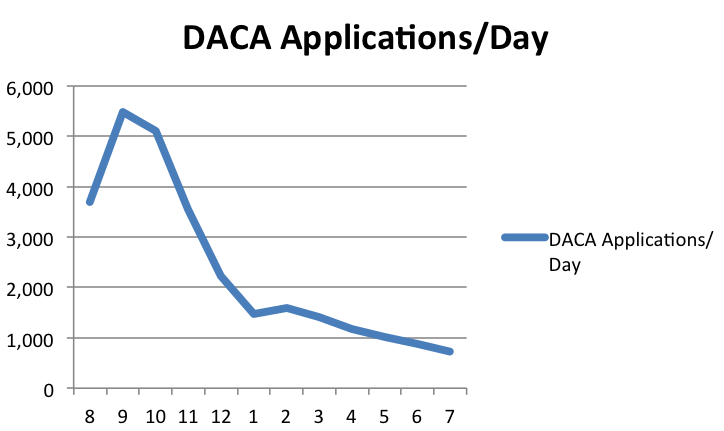
I think it is fair to say that any organization that is receiving thousands of applications a day is going to be drowning in paper.
There was a lot of discussion back in the summer of 2012 about what people should do. The election was in November. Should you wait and see what happened? What would Romney do if he won? Clearly, people didn’t wait. Since there was a risk that the program would be cancelled after the election, the dreamers didn’t wait. CIS were getting 5000 applications a day during September and October.
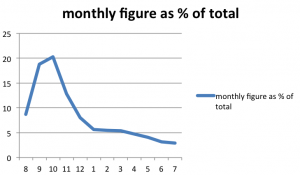
Lets look at this another way. Over the last year there have been 573,404 DACA applications. When you chart the percentage of the current total that came through each month, the graph (not surprisingly) is very similar to the per-day one.
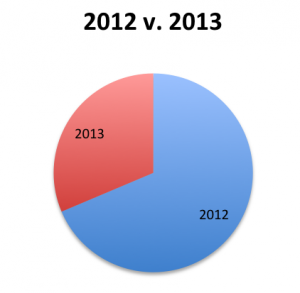
If we just compare the totals for the 5 months of 2012 against the 7 months of 2013, all is clear. Crazy pre-election panic followed by a steady, and slightly declining application rate since the new year.
And through this blizzard of paper, the service worked steadily to process the applications. And now they have almost caught up.
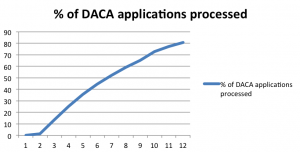
One thing that happens when you have “almost caught up” is that you can slow down. You don’t have to process applications at the same rate as before. One final graph.
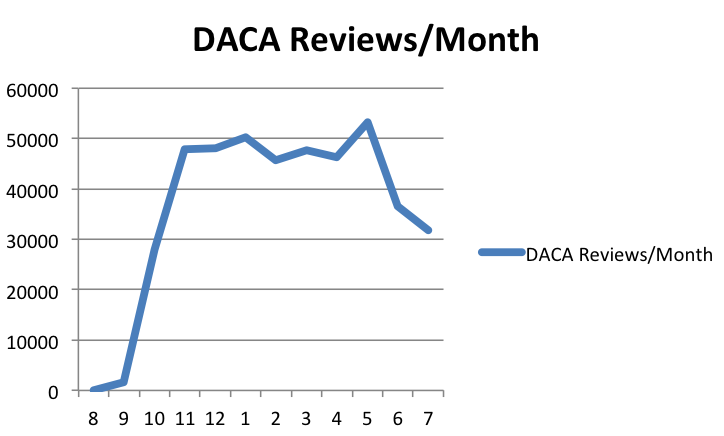
CIS are down to 30,000 reviews a month from a high point of 50,000. That very American 3/5 ratio means that reviewers have 40% more time to look at individual cases.
And all that extra free time… has come since May. More time, more care, more denials.
Of course, all the other possible explanations could be a factor. Maybe more marginal applications are coming through, when before only “perfect” candidates were stepping forward. Maybe the preparers have been less careful recently.
But the bottom line is that USCIS reviewers have caught up with the backlog. The pre-election flood of applications is now history. There is a much lower level of applications (700 a day last month).
Where does this leave the “DACA workshop?” Organizers are likely seeing reduced numbers, and are considering cutting back on the number and availability of workshop sessions. That could be unwise. Closer scrutiny by the service means that each application should get even more attention from immigration attorneys and volunteers. And maybe the clients will look elsewhere.
As the numbers drop, the demographics are also going to change. Yes there will be the latecomers. But increasingly, DACA will become a process for the rising 15s, as youngsters reach their 15th birthday and become eligible. And (if CIR does not become law in the near future) a regular stream of renewals. Both of these groups would do better with one-on-one consultations, rather than large group workshops. The rising 15s bring their families along, and DACA becomes an opportunity for an immigration “health check” for everyone. This is difficult in the large group setting, where organizations do not have the bandwidth to handle all the issues that can come from looking at the DACA applicant in the context of her family. And the renewal is indvidual and will require an attorney. Each renewing applicant has their own history. Are they still in school, have they had issues with the police, are there any red flags? Their status and their continued work authorization depends on a successful outcome, and it would be a false economy for them to roll the dice with a return to a workshop.
Whatever happens in the future, and whatever the trend, the numbers are still extraordinary. 437,686 applications have been processed. That’s almost 80%. 20,486 were rejected on intake (and hopefully resubmitted). And only 7,450 have been denied at review. That’s not many. It’s just that 3,690 of them were denied in the last couple of months.


Leave a Reply